Estonian state budget onepagers

Overview
Estonia's state budget comprises of various documents, ranging from detailed Excel tables to extensive text files. However, the most commonly used document is the State Budget Explanatory Document - a Microsoft Word file spanning over 600 pages, combining all numerical tables and explanatory text in one place. It provides a breakdown of financial information by each ministry and serves as a key reference point in parliamentary meetings and other legislative discussions.
Naturally, not every parliamentary member has the time to thoroughly review the entire document before each meeting. Moreover, while the budget is publicly accessible online, its length and complex language have made it difficult for citizens to interpret it.
To address this challenge, the Ministry of Finance sought a more efficient way to present the most relevant financial information to both the public and lawmakers. This led to the creation of state budget one-pagers - concise summaries designed to enhance accessibility and comprehension of the country’s financial matters. A year before we started with the project, the Ministry already had first prototypes of the onepagers that we set out to make user-friendly.
Process
we launched the project by meeting with ministry officials to define the key data points and the ideal format for the one-pagers. After understanding their needs, we explored various data visualization approaches, ensuring the final result would be both informative and visually engaging. My primary focus was on one-pagers related to governance areas (valitsemisalad).
Through multiple iterations, we refined our templates, incorporating feedback from the ministry to ensure clarity and cohesion. To maintain consistency, we aligned the design with the ministry’s existing visual language, using their official colors and fonts.

Visuals
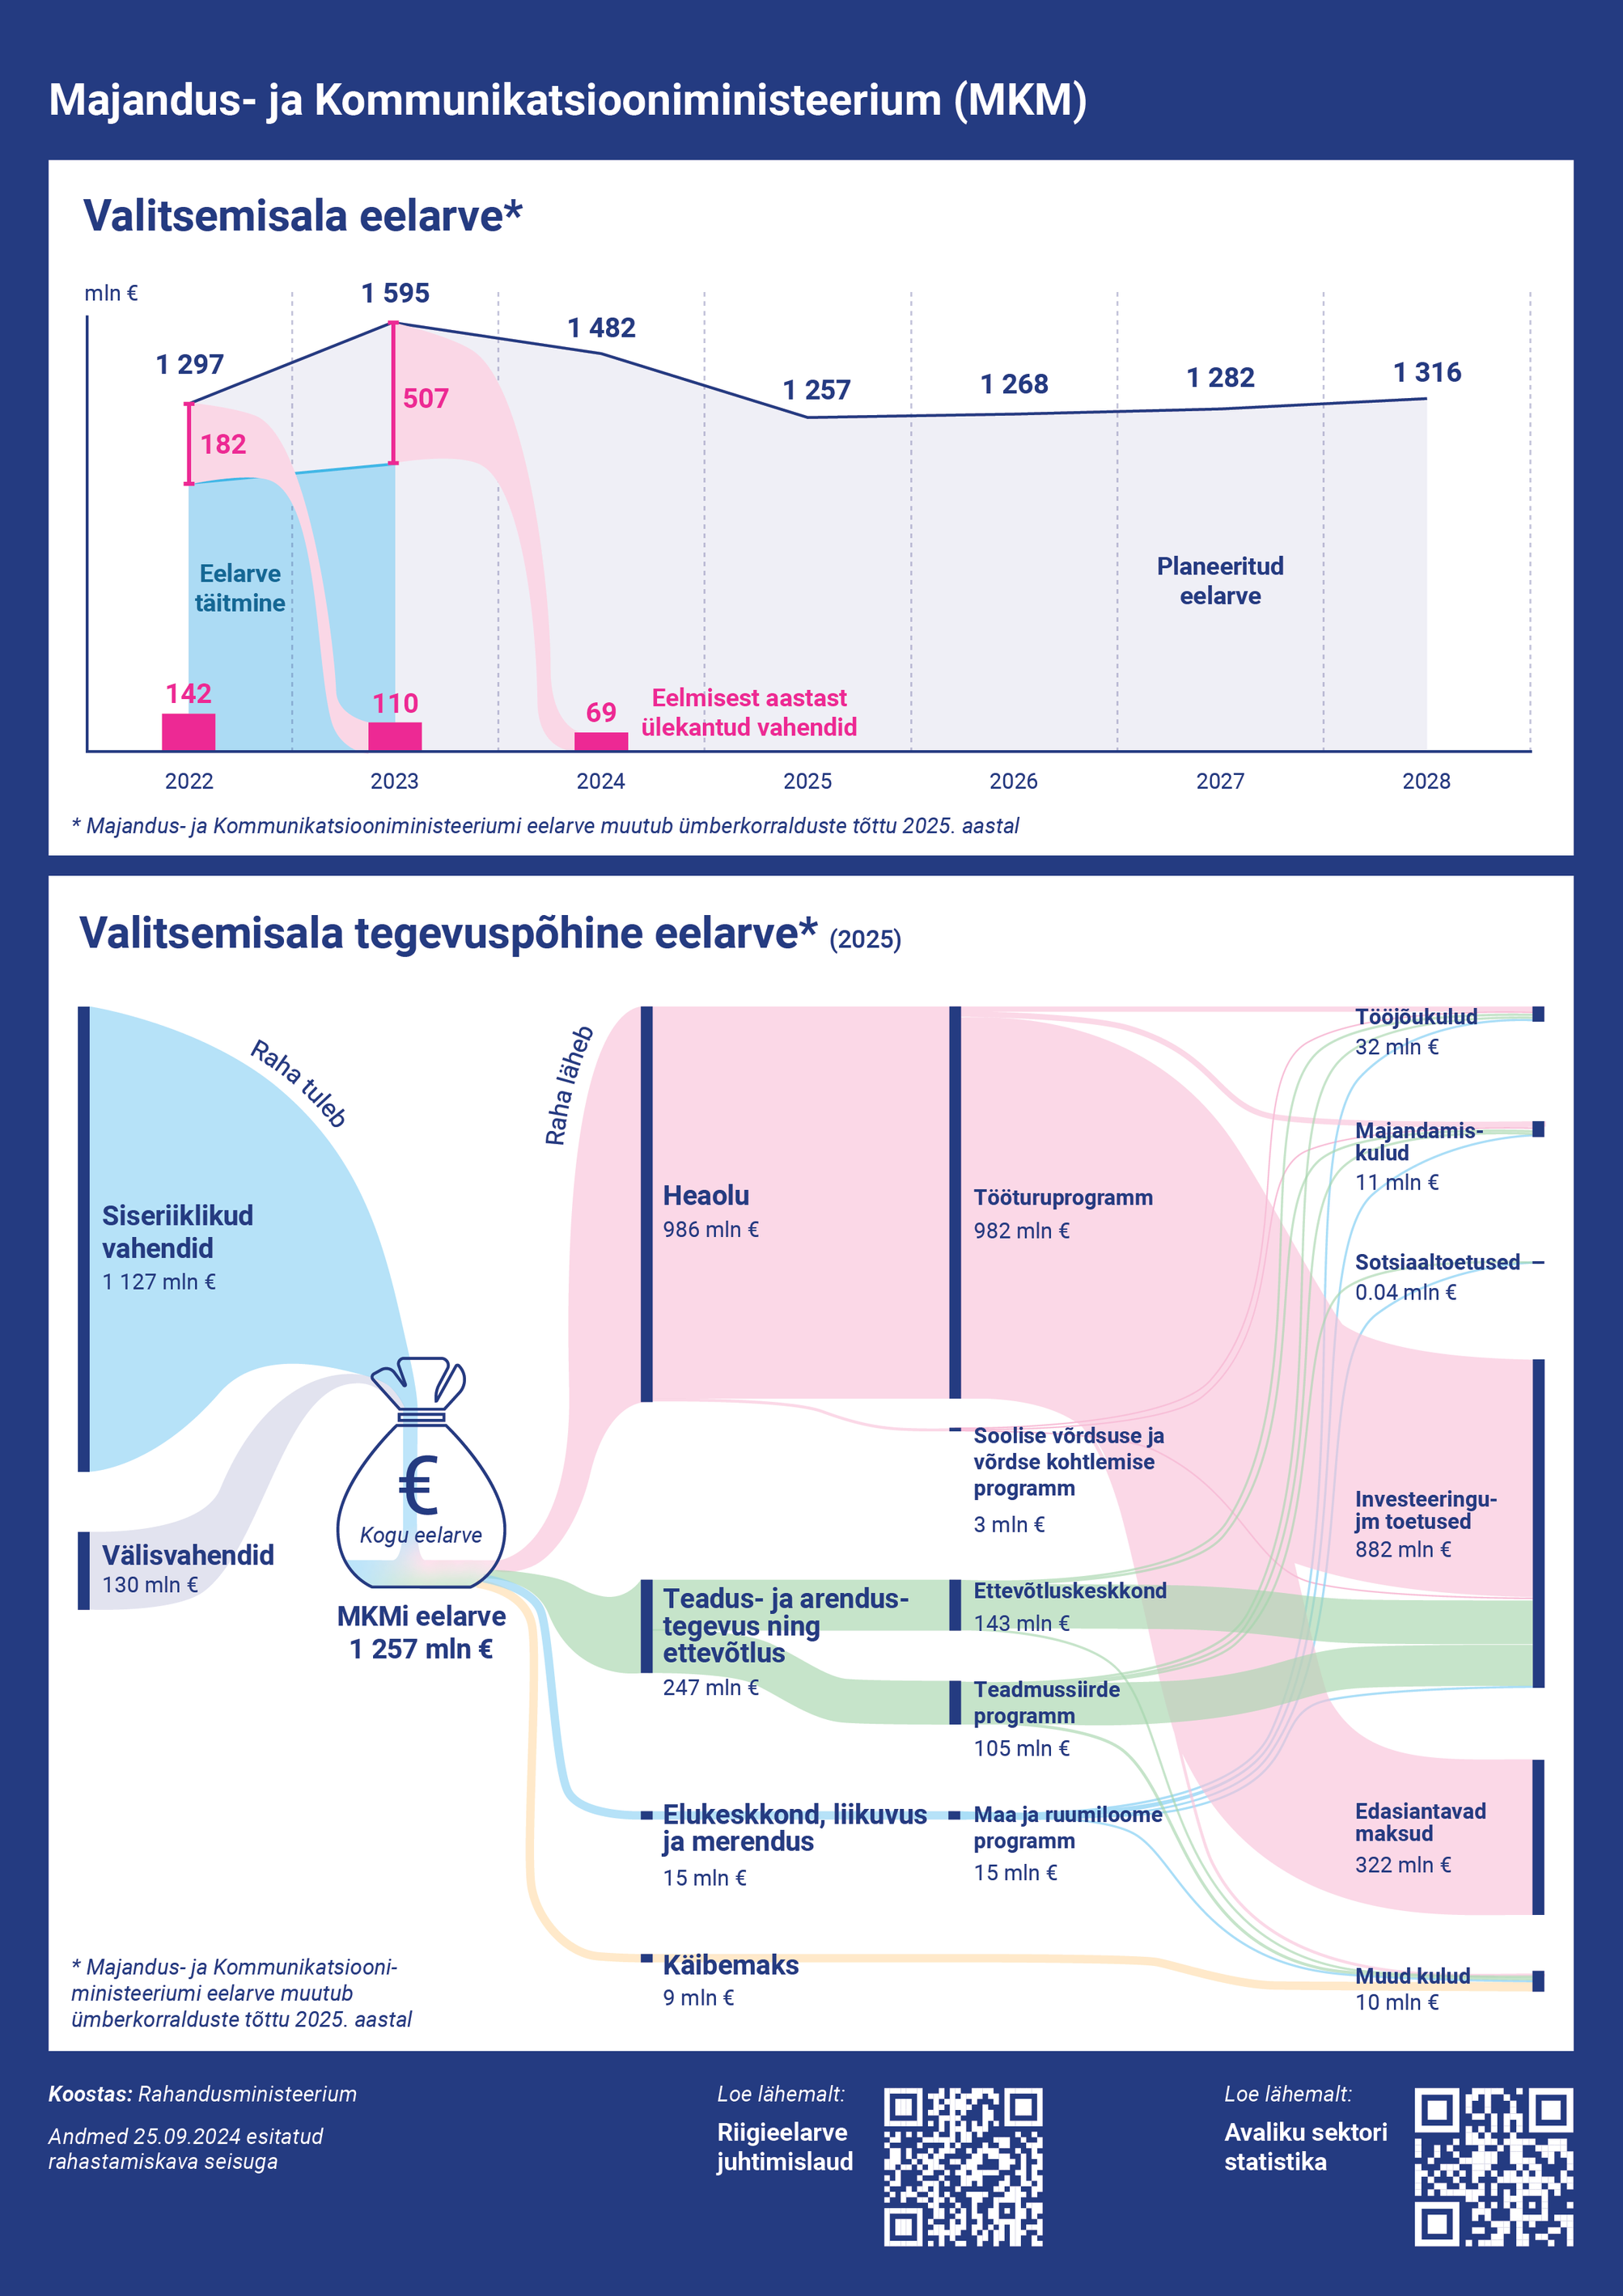
One of the most impactful visualizations we created was the budget graph. It presented complex financial data including allocated budgets, actual spending, differences between the two, and year-end carryovers. Collaborating closely with the ministry, we identified the most important figures, emphasized them visually, and structured the overall visual flow in a way that makes the relationships between the numbers easy to understand.

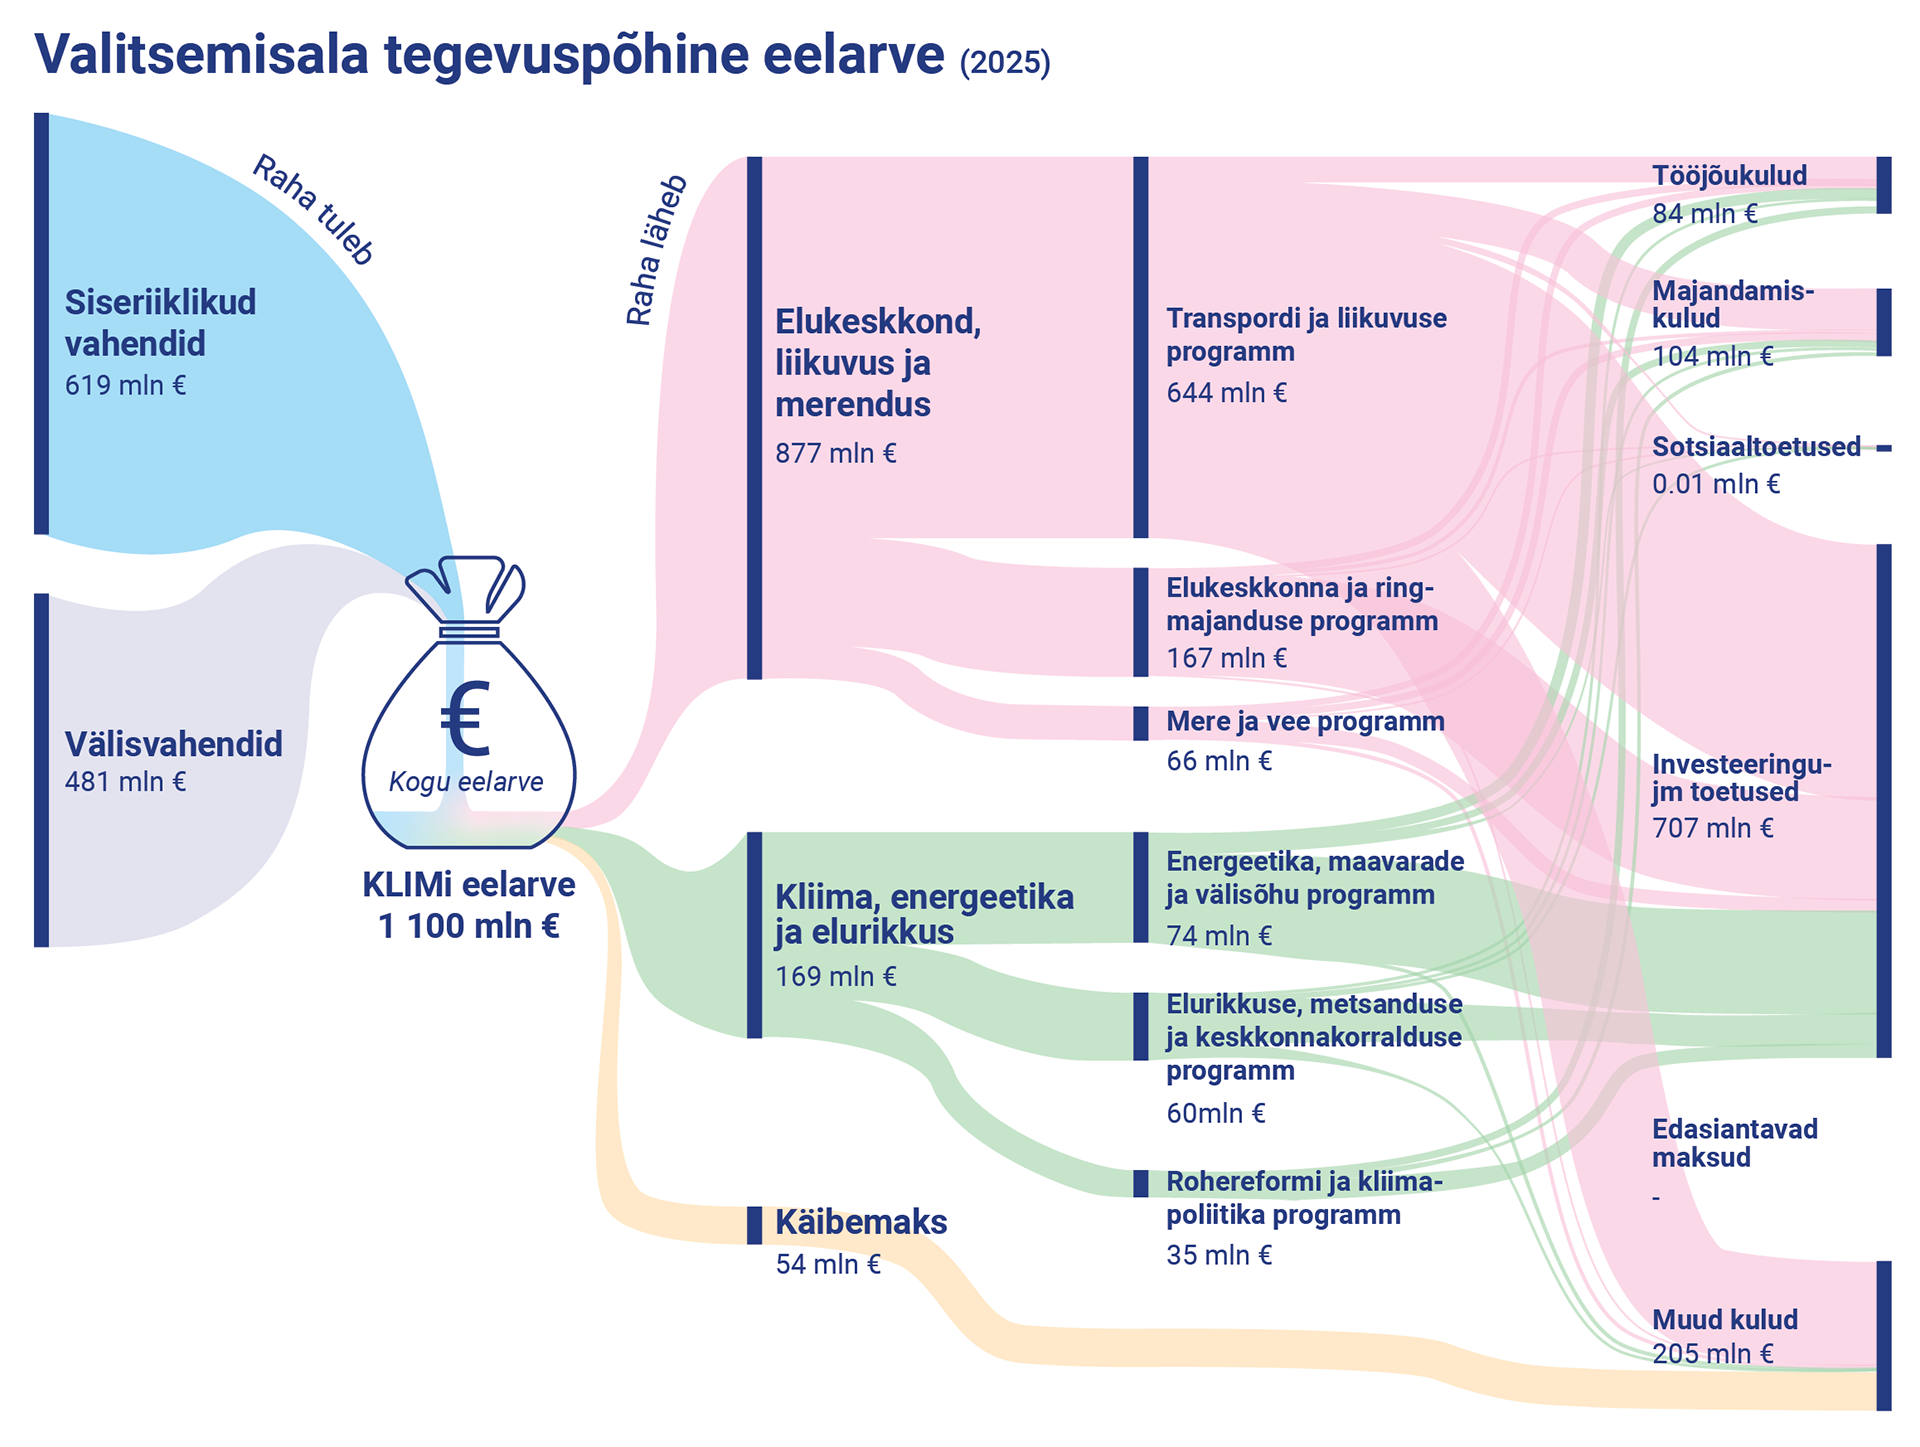
Another standout element was the Sankey diagram, which maps the flow of funds from government's assets to specific ministries and their programs. Despite handling a large volume of data, the graph is well-balanced and provides an intuitive overview of the budget.
Final solution
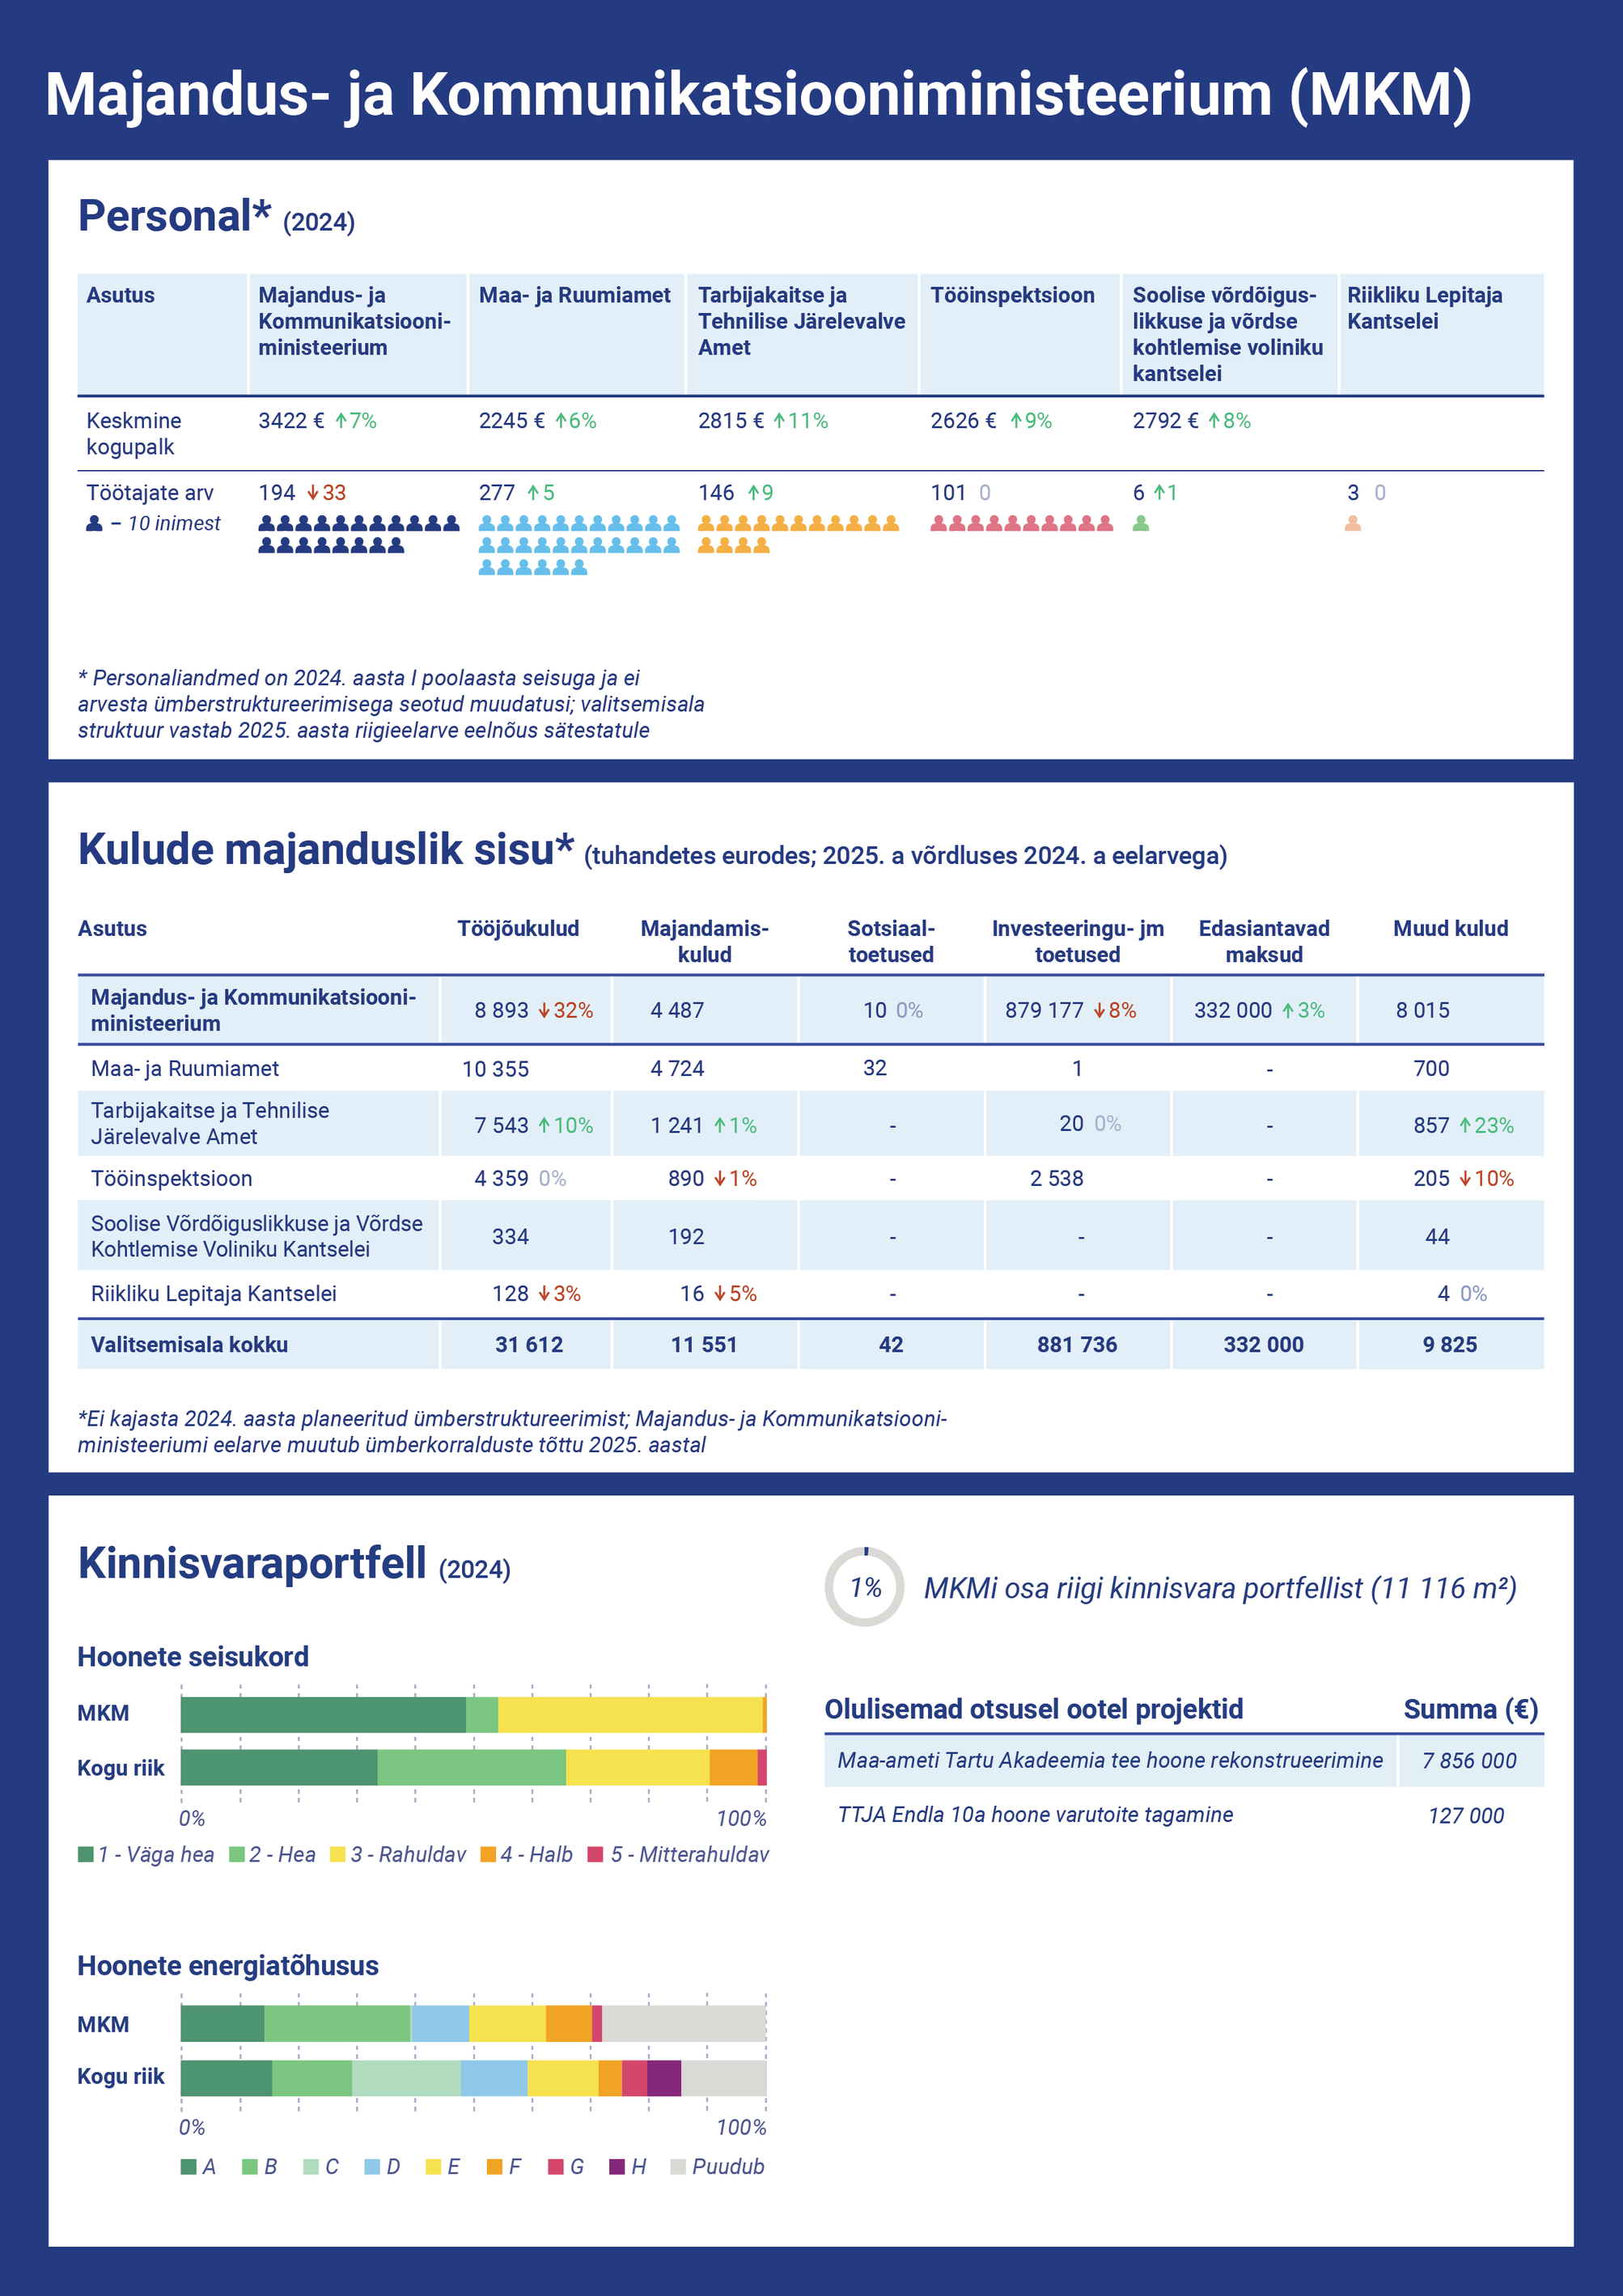
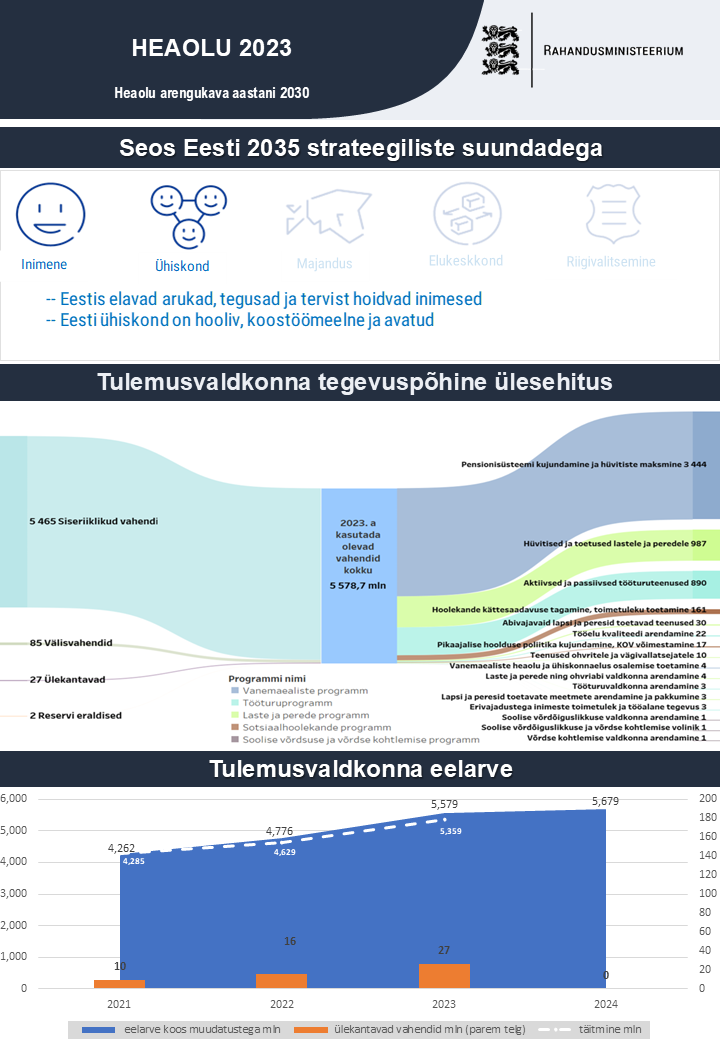
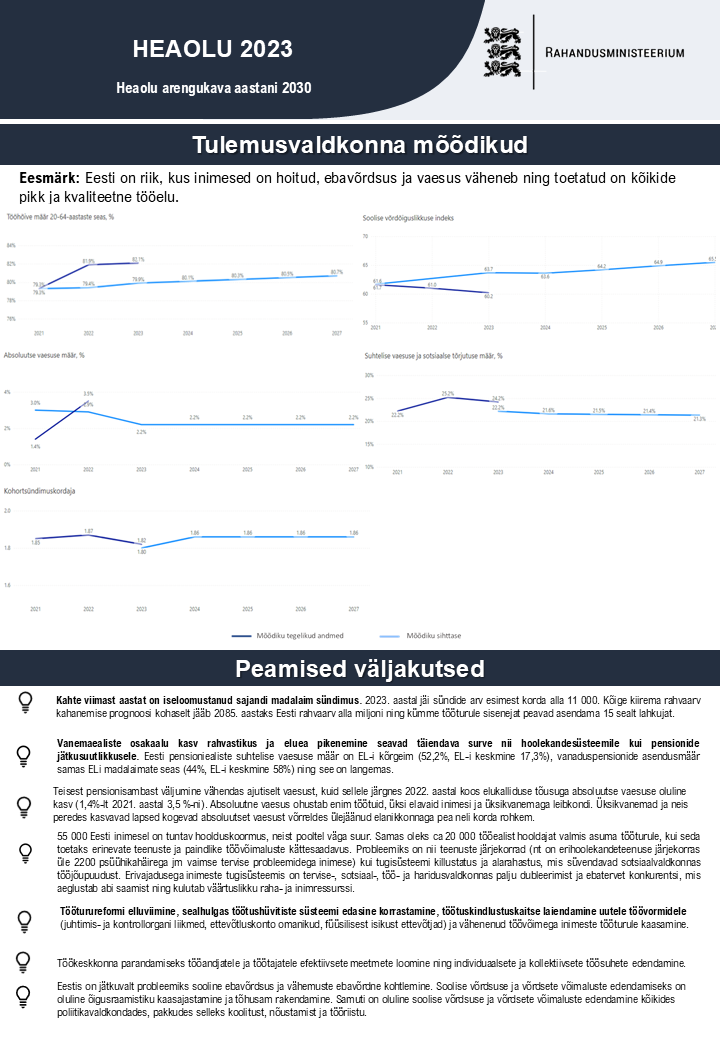
The two double-sided one-pagers feature seven distinct visualizations about Estonia's budget - employment details, expenses, real estate holdings, budget overview and it's distribution between different programs. The performance areas' one-pager also lists key metrics and challenges specific to each area.
These pages are featured in the state budget document, with printed versions distributed to parliamentary members and ministers. Individual graphs have also been used by various ministries in presentations, meetings and online platforms. By making Estonia's financial information more accessible, the one-pagers have helped parliament members make faster, more informed decisions while also providing citizens with a clearer understanding of the state's finances.